
ESG Metrics methodology
ESG rating
We decided to publish three indicators in our fund reports in order to enable our client to measure the integration of ESG criteria into the funds and to increase our level of transparency regarding our responsible investment strategy. These ESG metrics are updated monthly. They are used for information purposes only. The funds do not have regulatory or contractual ESG objectives.
The absolute ESG rating
The absolute ESG rating is based on an assessment method specific to AXA IM (ESG score from 0 to 10). The AXA IM proprietary ESG scoring methodology is developed and maintained by our internal Responsible Investment Team.
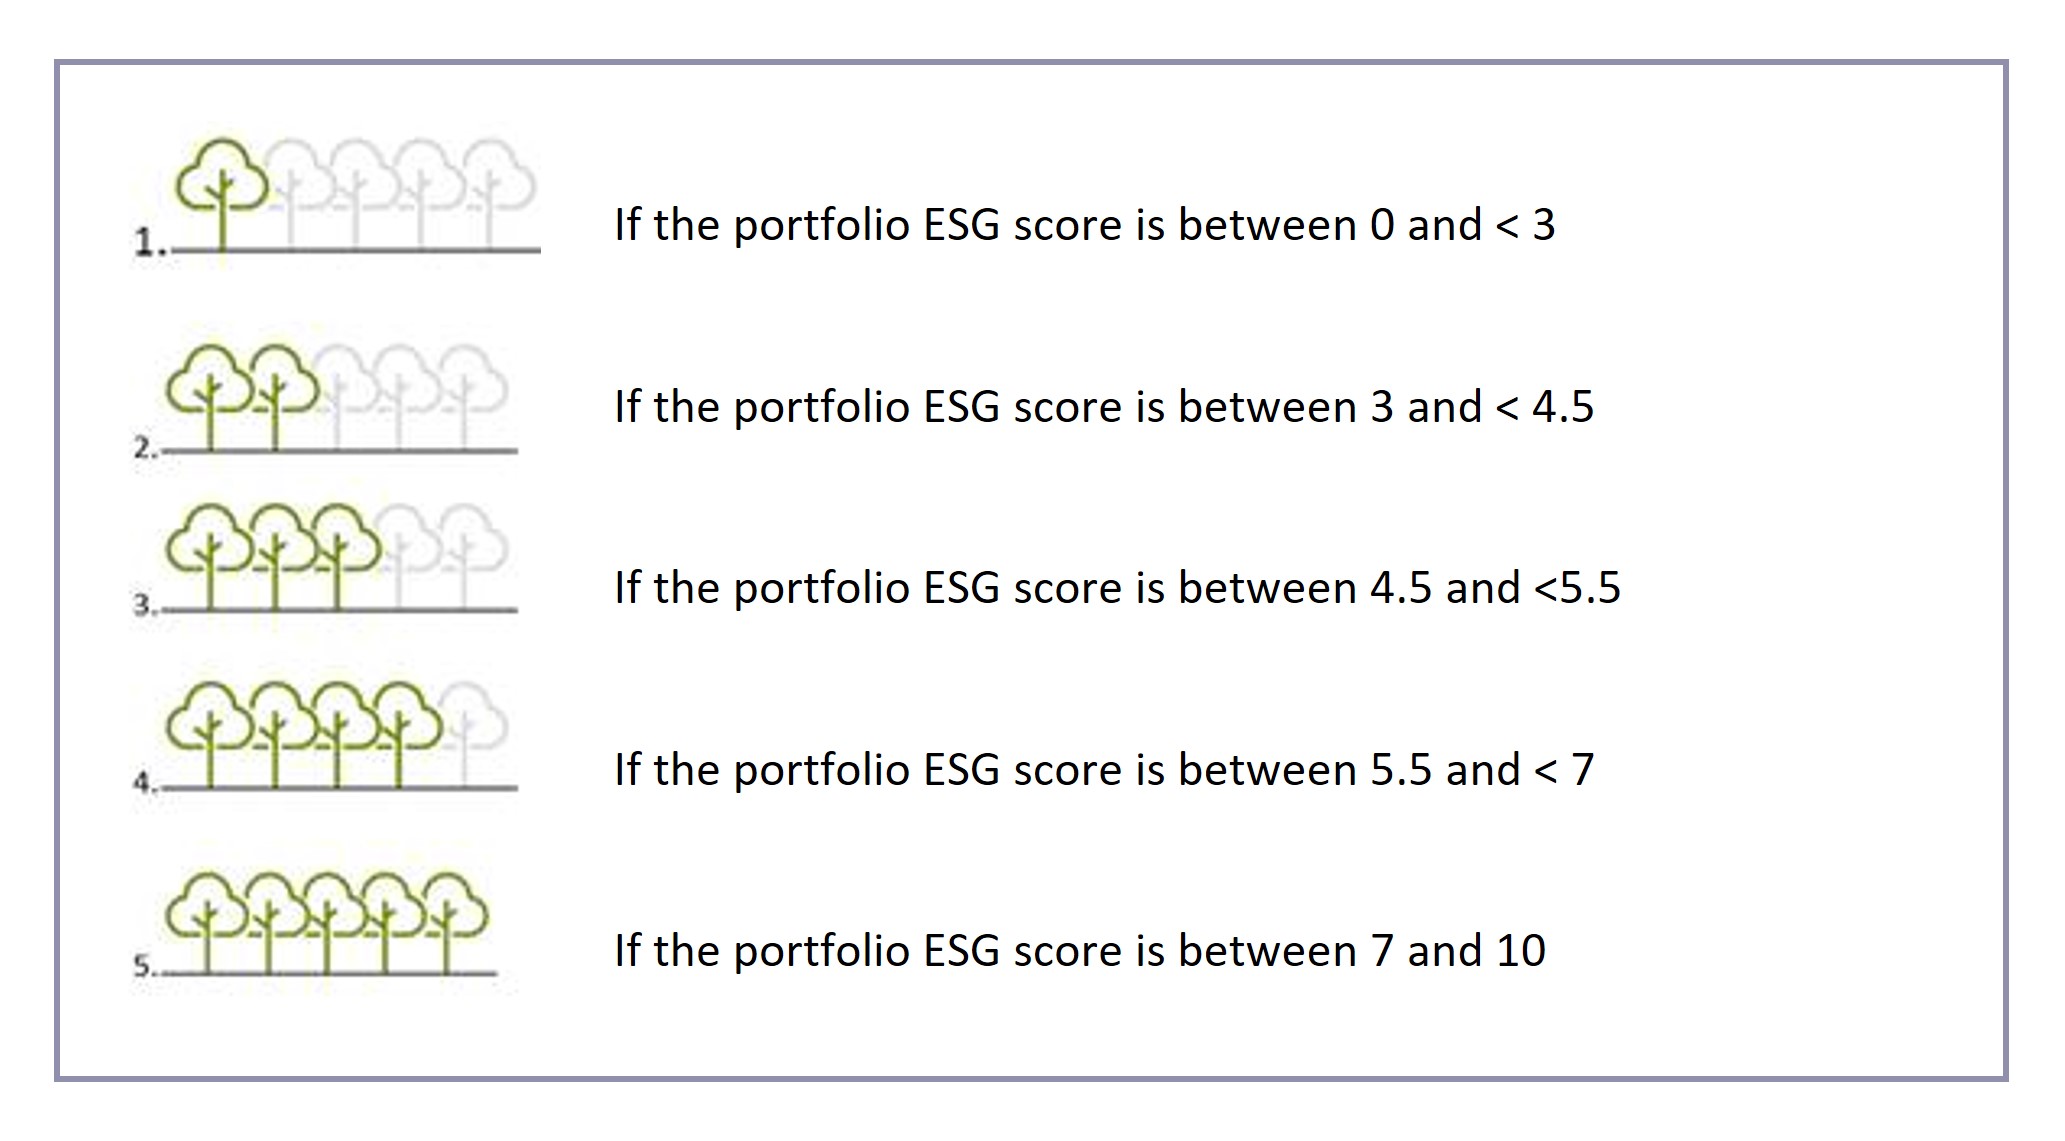
The rationale for a non-linear scale for the tree and ‘gas gauge’ object is that the ESG data is not linearly distributed – companies (and portfolios) will cluster around the central tendency. It’s harder to improve the portfolio at the centre of the distribution so a score that is more than 0.5 different from the central value of 5 should be recognised.
In top of that, it enables to have more dispersion through ratings 2,3,4 leaves and avoid concentration on 3. Finally it may be more incentive for PM to improve its selection in order to get the upper tree.
The relative ESG rating
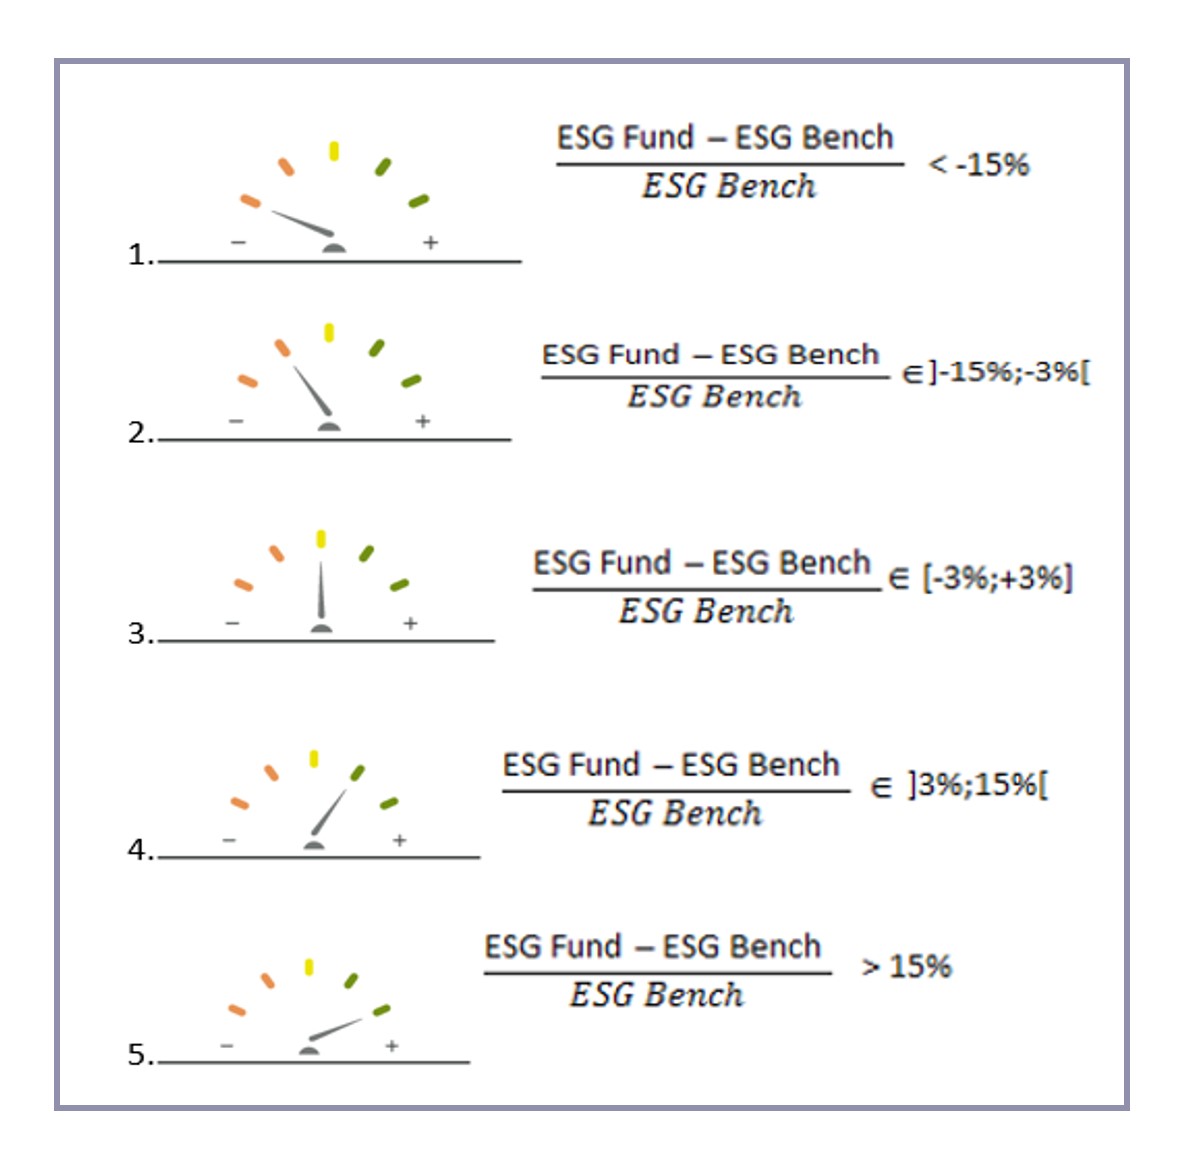
The relative ESG rating is the difference between the fund's absolute ESG rating and the absolute ESG rating of its benchmark or performance indicator. If the fund does not have a benchmark or performance indicator, the relative ESG rating will not be calculated1.
Interpretation:
- If the relative ESG rating is mentioned in green, it means that the absolute ESG score of the fund is between 3% and 15% or > 15% compared to the performance indicator;
- If the relative ESG rating is mentioned in yellow, it means that the absolute ESG score of the fund is between -3% and 3% compared to the performance indicator;
- If the relative ESG rating is indicated in orange, it means that the absolute ESG score of the fund is between -3% and -15% or < -15% compared to the performance indicator.
Similar above, the rationale for an non linear scale for the ESG Relative rating is that a 3% difference in score is (statistically) significant, especially in the centre of the distribution where most portfolios tend to ‘live’.
The relative CO2 intensity
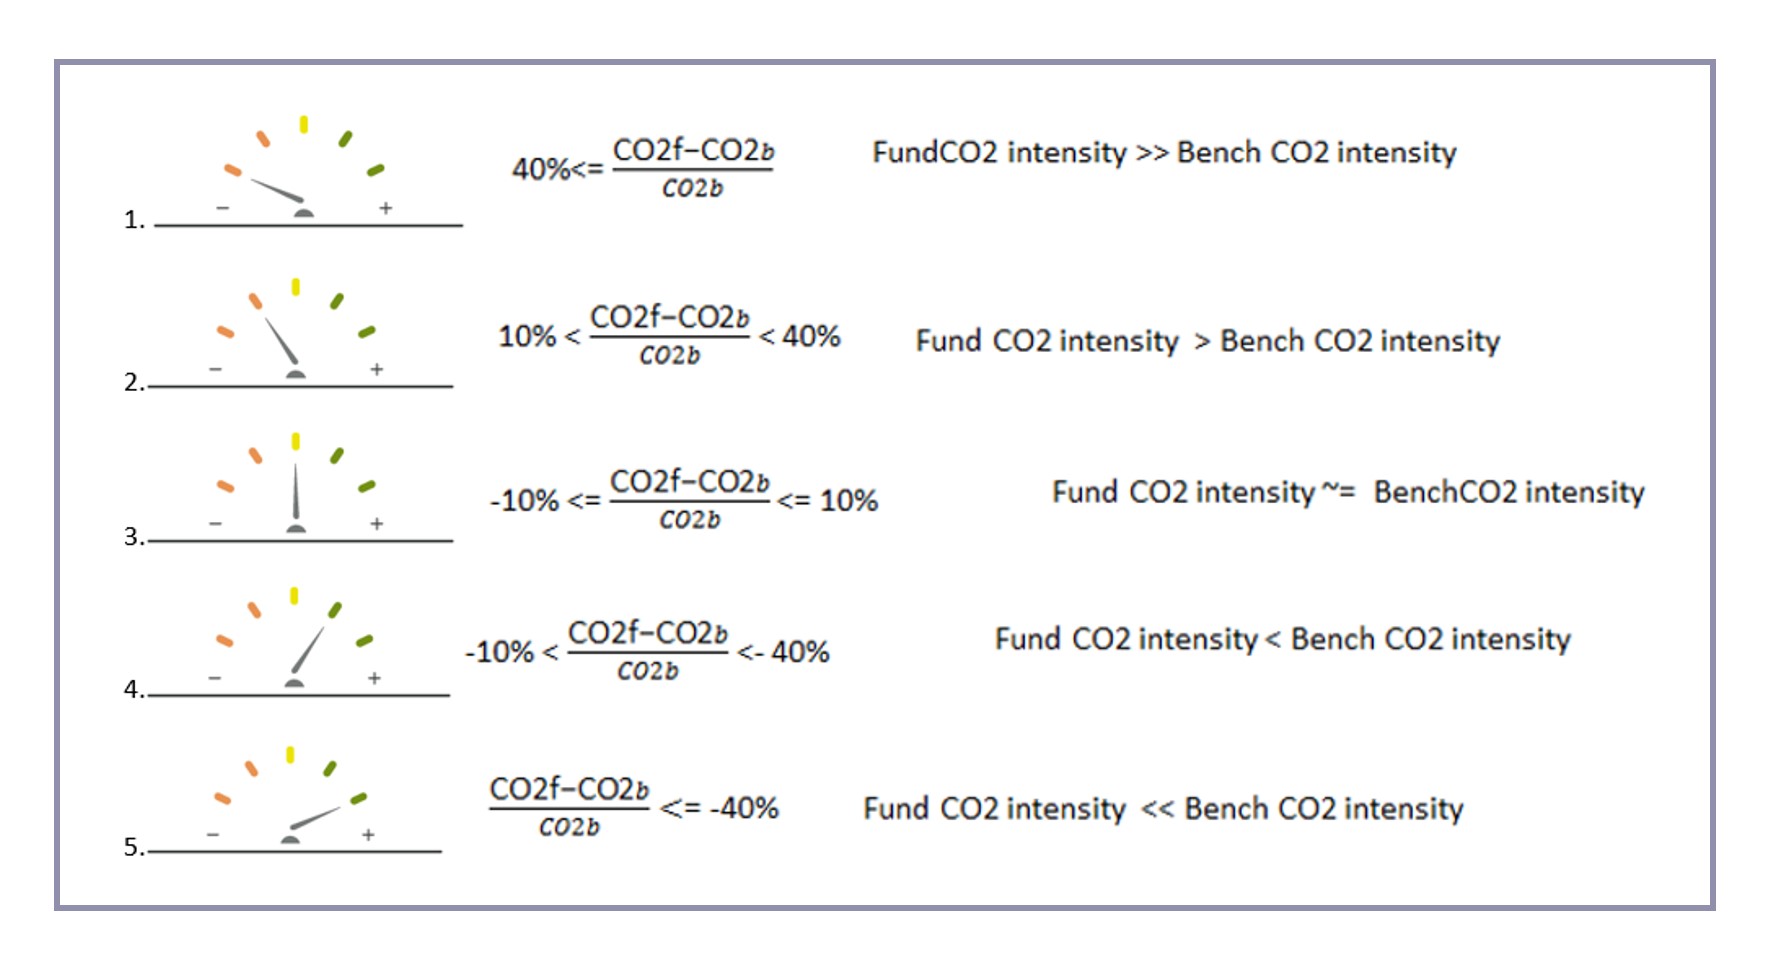
The relative CO2 intensity refers to the carbon footprint of the fund and corresponds to the difference between the CO2 intensity of the fund (expressed in tonnes of CO2/million € of revenue) and the one of the benchmark or performance indicator. If the fund does not have a benchmark or performance indicator, the relative CO2 intensity will not be calculated2.
Interpretation:
- If the relative CO2 intensity is green, it means that the CO2 intensity of the fund is between 10% and 40% or more than 40% lower than the CO2 intensity of the performance indicator;
- If the relative CO2 intensity is yellow, it means that the CO2 intensity of the fund is between -10% and 10% of the CO2 intensity of the performance indicator;
- If the relative CO2 intensity is orange, it means that the CO2 intensity of the fund is between 10% and 40% or more than 40% higher than the CO2 intensity of the performance indicator.
1 Most of funds have a performance indicator used as a comparison only for management purposes. If a fund does not have a performance indicator, the relative ESG rating will not be calculated or displayed.
2 Most funds have a performance indicator used as a comparison only for management purposes. If a fund does not have a performance indicator, the relative CO2 intensity will not be calculated or displayed.


Disclaimer
This document does not constitute investment research or financial analysis relating to transactions in financial instruments as per MIF Directive (2014/65/EU), nor should not be considered as solicitation or investment, legal or tax advice, a recommendation for an investment strategy or a personalized recommendation to buy or sell securities.
Due to its simplification, this document is partial and opinions, estimates and forecasts herein are subjective and subject to change without notice. There is no guarantee forecasts made will come to pass. Data, figures, declarations, analysis, predictions and other information in this document is provided based on our state of knowledge at the time of creation of this document. Whilst every care is taken, no representation or warranty (including liability towards third parties), express or implied, is made as to the accuracy, reliability or completeness of the information contained herein
Information about the staff of AXA Investment Managers group and / or AXA Investment Managers is only informative. We do not guarantee the fact that staff remains employed by AXA Investment Managers group and / or AXA Investment Managers and exercise or continue to exercise in AXA Investment Managers group and / or AXA Investment Managers.
Issued by AXA INVESTMENT MANAGERS PARIS, a company incorporated under the laws of France, having its registered office located at Tour Majunga, 6 place de la Pyramide, 92800 Puteaux, registered with the Nanterre Trade and Companies Register under number 353 534 506, and a Portfolio Management Company, holder of AMF approval no. GP 92-08, issued on 7 April 1992. In other jurisdictions, this document is issued by AXA Investment Managers SA’s affiliates in those countries.
Risk Warning
The value of investments, and the income they generate, can go down as well as up and investors may not get back the amount originally invested.